Menu

Wednesday, 26 September 2018

Apache Mod Cluster as load balancer (LB) - JBoss 6.4


Connector
Supports Sticky Sessions
Adapts to Deployment Status
Yes
Yes. Detects deployment and undeployment of applications and dynamically decides whether to direct client requests to a server based on whether the application is deployed on that server.
Yes
No. Directs client requests to the container as long as the container is available, regardless of application status.
Yes
No. Directs client requests to the container as long as the container is available, regardless of application status.
Yes
No. Directs client requests to the container as long as the container is available, regardless of application status.
Yes
No. Directs client requests to the container as long as the container is available, regardless of application status.

Advantages:
  • ·         Workers register themselves with httpd servers.
  • ·         NO more workers.properties
  • ·         Changes in cluster topology are send to httpd.
  • ·         Deployed applications are automatically register, which can be Disable, stop & Enable    from balancer HTTP console.
  • ·         NO 404s for un-deployed applications.
  • ·         Load balancer function automatically managed.

Software Details:


Step 1: Install Apache server on UNIX.

Use below link to install Apache server on UNIX step by step.


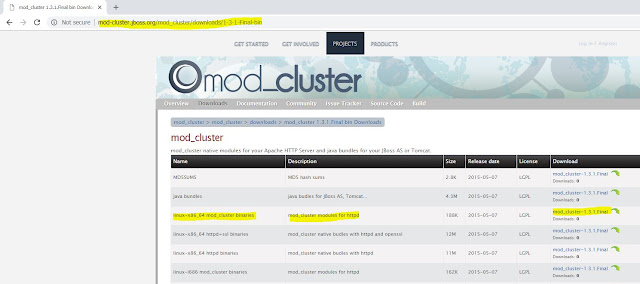
Step 2: Download “mod_cluster modules for httpd” from below link, as per your environment.


Screenshot: 


Screenshot: 


Step 3: Move this mod_cluster modules to installed Apache server modules location.  “$Apache_Home/modules”.


Step 4: Add below configuration to httpd.conf file at “$Apache_Home/conf”.

NOTE: Disable mod_proxy_balancer module.
# mod_proxy_balancer should be disabled while using mod_cluster.

***************************************************************
LoadModule proxy_module modules/mod_proxy.so
LoadModule proxy_ajp_module modules/mod_proxy_ajp.so
LoadModule proxy_cluster_module modules/mod_proxy_cluster.so
LoadModule cluster_slotmem_module modules/mod_cluster_slotmem.so
LoadModule manager_module modules/mod_manager.so
LoadModule advertise_module modules/mod_advertise.so

MemManagerFile /Apache/HTTPDWEB2.4/MemManagerFile

<IfModule manager_module>
Listen 10.142.0.2:9111
        ManagerBalancerName mycluster-1
        ManagerBalancerName mycluster-2

<VirtualHost 10.142.0.2:9111>
    <Directory />
##      AllowOverride None
      Require all granted
    </Directory>
    ServerAdvertise off
        EnableMCPMReceive
        KeepAliveTimeout 60

<Location /mod_cluster_manager>
    SetHandler mod_cluster-manager
      Require all granted
</Location>

</VirtualHost>
</IfModule>

AllowDisplay On
***************************************************************

Where,
MemManagerFile: That is the base name for the names mod_manager will use to store configuration, generate keys for shared memory or lock files. That must be an absolute path name; the directories will created if needed. It is highly recommended that those files are placed on a local drive and not an NFS share.
Default: $Apache_Home/logs/.

ServerAdvertise On: Use the advertise mechanism to tell the JBoss AS to whom it should send the cluster information.
ServerAdvertise On http://hostname:port: Tell the hostname and port to use. Only needed if the VirtualHost is not defined correctly, if the VirtualHost is a Name-based Virtual Host [http:// httpd.apache.org/docs/2.2/vhosts/name-based.html] or when VirtualHost is not used.
ServerAdvertise Off: Don't use the advertise mechanism.

EnableMCPMReceive - Allow the VirtualHost to receive the MCPM from the nodes. You need one EnableMCPMReceive in your httpd configuration to allow mod_cluster to work, put it in the VirtualHost where you configure advertise.

SetHandler mod_cluster-manager: That is the handler to display the node mod_cluster sees from the cluster. It displays the information about the nodes like INFO and additionally counts the number of active sessions.

NOTE:
On httpd 2.2
#########
Order allow,deny
Allow from all
#########

And On   httpd 2.4 we use,
#########
Require all granted
#########

We have done with mod_cluster configuration on Apache Server.

Screenshot:


 Screenshot:

Step 5:  For performing  mod_cluster method, we need to use standalone-ha.xml or standalone-full-ha.xml profile, Since this ha & full-ha has a mod_cluster subsystem configuration.
We will use ha profile.


Step 6: Add Jboss Server name on “standalone-ha.xml”.
**********************************************
<?xml version='1.0' encoding='UTF-8'?>

<server name="jboss-eap-6.4-1"   xmlns="urn:jboss:domain:1.7">
    <extensions>
**********************************************

Screenshot:


Step 7: Add Proxy-list and  Balancer name to “standalone-ha.xml” mod cluster subsystem.

***************************
        <subsystem xmlns="urn:jboss:domain:modcluster:1.2">
            <mod-cluster-config proxy-list="10.142.0.2:9111"  advertise-socket="modcluster" connector="ajp" balancer="mycluster-1" >
                <dynamic-load-provider>
                    <load-metric type="busyness"/>
                </dynamic-load-provider>
            </mod-cluster-config>
        </subsystem>
***************************
 Screenshot:


Step 8: Add Node name to “standalone-ha.xml” web subsystem.

  ***************************
     <subsystem xmlns="urn:jboss:domain:web:2.2" default-virtual-server="default-host" native="false" instance-id="jboss-eap-Node-1" >
            <connector name="http" protocol="HTTP/1.1" scheme="http" socket-binding="http"/>
            <connector name="ajp" protocol="AJP/1.3" scheme="http" socket-binding="ajp"/>
            <virtual-server name="default-host" enable-welcome-root="true">
                <alias name="localhost"/>
                <alias name="example.com"/>
            </virtual-server>
        </subsystem>
***************************

Screenshot:


 Step 9: Start the “JBoss instance-1” from “$JBOSS_HOME-1/bin”, using below script,

./standalone.sh  -c  standalone-ha.xml   -b  10.142.0.2  -bmanagement  10.142.0.2

 Screenshot:


Step 10: Now, perform same configuration changes using different server name, balancer name & instance-id on “JBoss instance-2”.

NOTE:  use port offset for socket-binding on “standalone-ha.xml”.

**********************************
  <socket-binding-group name="standard-sockets" default-interface="public" port-offset="${jboss.socket.binding.port-offset:10}">
**********************************


Step 11: Start the “JBoss instance-2” from  “$JBOSS_HOME-2/bin”, using below script.

./standalone.sh  -c  standalone-ha.xml   -b  10.142.0.2  -bmanagement  10.142.0.2

Screenshot:


Step 12: Check through browser, using http://ip:PORT/mod_cluster_manager


 Screenshot:


Step 13: check the applications.


 Screenshot:


Reference links:


Thanks :-)


Thursday, 20 September 2018

Monitoring of JBoss servers through Nagios-Tool.

Nagios, now known as Nagios Core, is a free and open source computer-software application that monitors systems, networks and infrastructure. Nagios offers monitoring and alerting services for servers, switches, applications and services. It alerts users when things go wrong and alerts them a second time when the problem has been resolved.

Step 1: Navigate to $JBOSS_Home/bin and edit standalone.conf.bat

Step 2: Add below configuration on standalone.conf.bat file.

****************************************
set "JAVA_OPTS=%JAVA_OPTS% -Xbootclasspath/p:D:\JBOSS\jboss-as-7.1.1.Final\modules\org\jboss\logmanager\main\jboss-logmanager-1.2.2.GA.jar -Xbootclasspath/p:D:\JBOSS\jboss-as-7.1.1.Final\modules\org\jboss\logmanager\log4j\main\jboss-logmanager-log4j-1.0.0.GA.jar -Xbootclasspath/p:D:\JBOSS\jboss-as-7.1.1.Final\modules\org\apache\log4j\main\log4j-1.2.16.jar"

set "JAVA_OPTS=%JAVA_OPTS% -Djava.util.logging.manager=org.jboss.logmanager.LogManager"

set "JAVA_OPTS=%JAVA_OPTS% -Djboss.modules.system.pkgs=org.jboss.byteman,org.jboss.logmanager"

set "JAVA_OPTS=%JAVA_OPTS% -Dcom.sun.management.jmxremote   -Dcom.sun.management.jmxremote.local.only=false  -Dcom.sun.management.jmxremote.authenticate=false  -Dcom.sun.management.jmxremote.ssl=false"

set "JAVA_OPTS=%JAVA_OPTS% -Dcom.sun.management.jmxremote.port=9002"

set "JAVA_OPTS=%JAVA_OPTS% -Djava.rmi.server.hostname=192.168.XXX.XXX"
****************************************


Step 3: Restart the JBoss.


Step 4: Provide below document to  IT-Team/Server Team, to install the check_jmx plugin & jmxquery.jar on Nagios (libraries) /usr/local/nagios/libexec/    


Document URL : https://assets.nagios.com/downloads/nagiosxi/docs/Monitoring-JMX-with-Nagios-XI.pdf


Step 5 : Provide below nagios commands  to IT-Team for configuration on Nagios tool console.

********************************************
./check_jmx -U service:jmx:rmi:///jndi/rmi://192.168.199.177:9002/jmxrmi  -O java.lang:type=Threading -A ThreadCount -w 450 -c 550


## Heap memory used## warning 5GB  to critical 6.5 GB
./check_jmx -U service:jmx:rmi:///jndi/rmi://192.168.199.177:9002/jmxrmi -O java.lang:type=Memory -A HeapMemoryUsage -K used -I HeapMemoryUsage -J used -vvvv -w 5098760192 -c 6598760192


## NON-heap memory usage## warning 1GB  to critical 1.5 GB
./check_jmx -U service:jmx:rmi:///jndi/rmi://192.168.199.177:9002/jmxrmi -O java.lang:type=Memory -A NonHeapMemoryUsage -K used -I NonHeapMemoryUsage -J used -vvvv -w 1073741824 -c 1500000000


## DaemonThreadCount ## warning 100 to critical 250
./check_jmx -U service:jmx:rmi:///jndi/rmi://192.168.199.177:9002/jmxrmi  -O java.lang:type=Threading -A DaemonThreadCount -w 100 -c 250


## SystemLoadAverage ## warning 70 to  critical 90
./check_jmx -U service:jmx:rmi:///jndi/rmi://192.168.199.177:9002/jmxrmi -O java.lang:type=OperatingSystem -A SystemLoadAverage -w 70 -c 90


## LoadedClassCount ##
./check_jmx -U service:jmx:rmi:///jndi/rmi://192.168.199.177:9002/jmxrmi -O java.lang:type=ClassLoading -A LoadedClassCount -K used


##  LastGcInfo -K duration ## Returns the elapsed time of this GC in milliseconds
./check_jmx -U service:jmx:rmi:///jndi/rmi://192.168.199.177:9002/jmxrmi  -O java.lang:type=GarbageCollector,name=ParNew -A LastGcInfo -K duration7220


## CollectionTime for ConcurrentMarkSweep ## collect the GC time in milliseconds
./check_jmx -U service:jmx:rmi:///jndi/rmi://192.168.199.177:9002/jmxrmi -O java.lang:type=GarbageCollector,name=ConcurrentMarkSweep -A CollectionTime


## CollectionCount for ConcurrentMarkSweep ## total numbers of time GC collected
./check_jmx -U service:jmx:rmi:///jndi/rmi://192.168.199.177:9002/jmxrmi -O java.lang:type=GarbageCollector,name=ConcurrentMarkSweep -A CollectionCount


## CollectionCount for ParNew ## total numbers of time GC collected
./check_jmx -U service:jmx:rmi:///jndi/rmi://192.168.199.177:9002/jmxrmi -O java.lang:type=GarbageCollector,name=ParNew -A CollectionCount


## CollectionTime for ParNew ##  collect the GC time in milliseconds
./check_jmx -U service:jmx:rmi:///jndi/rmi://192.168.199.177:9002/jmxrmi -O java.lang:type=GarbageCollector,name=ParNew -A CollectionTime

############################

############################

./check_ajp  -app 192.168.199.177 --port 8009   --warn 1 --crit 2 --timeout 5

./check_website.sh  192.168.199.177:8080/MiddlewareBox/login.jsp

############################


Screenshot:


Thanks :-)


JBoss- Remote JMX Connection (jvisualvm)

Java VisualVM is a tool that provides a visual interface for viewing detailed information about Java technology-based applications (Java applications) while they are running on a Java Virtual Machine (JVM).

ava VisualVM can be used by Java application developers/administrator to troubleshoot applications and to monitor and improve the applications' performance. Java VisualVM can allow developers to generate and analyse heap dumps, track down memory leaks, browse the platform's MBeans and perform operations on those MBeans, perform and monitor garbage collection, and perform lightweight memory and CPU profiling.

Step 1: Navigate to $JBOSS_Home/bin and edit standalone.conf.bat

Step 2: Add below configuration on standalone.conf.bat file.

*****************************************
set "JAVA_OPTS=%JAVA_OPTS% -Djboss.platform.mbeanserver"

set "JAVA_OPTS=%JAVA_OPTS% -Xbootclasspath/p:D:\JBOSS\jboss-as-7.1.1.Final\modules\org\jboss\logmanager\main\jboss-logmanager-1.2.2.GA.jar -Xbootclasspath/p:D:\JBOSS\jboss-as-7.1.1.Final\modules\org\jboss\logmanager\log4j\main\jboss-logmanager-log4j-1.0.0.GA.jar -Xbootclasspath/p:D:\JBOSS\jboss-as-7.1.1.Final\modules\org\apache\log4j\main\log4j-1.2.16.jar"

set "JAVA_OPTS=%JAVA_OPTS% -Djava.util.logging.manager=org.jboss.logmanager.LogManager"

set "JAVA_OPTS=%JAVA_OPTS% -Djboss.modules.system.pkgs=org.jboss.byteman,org.jboss.logmanager"

set "JAVA_OPTS=%JAVA_OPTS% -Dcom.sun.management.jmxremote   -Dcom.sun.management.jmxremote.local.only=false  -Dcom.sun.management.jmxremote.authenticate=false  -Dcom.sun.management.jmxremote.ssl=false"

set "JAVA_OPTS=%JAVA_OPTS% -Dcom.sun.management.jmxremote.port=9002"

set "JAVA_OPTS=%JAVA_OPTS% -Djava.rmi.server.hostname=192.168.XXX.XXX"

****************************************

Where,
           You can change port numbers & host name IP.

screenshot: 


Step 3:  Navigate to $JAVA_HOME/bin of remote machine & open jvisualvm application as an administrator.


Step 4: Right Click on Remote & Add Remote Host (IP).


Step 5:  Add JMX connection using port number (9002) used on standalone.conf.bat, OK


Step 6: Open the connection & click on  Monitor.


Thanks :-)


Wednesday, 19 September 2018

Issue SocketTimeoutException – (Apache Mod-jk & JBoss)


Hi folks, from last week I am facing “SocketTimeoutException”.  JBoss servers getting down automatically getting above exception also there were spike in memory utilization.
This SocketTimeoutException is occurred when the system was idle for more time, and there is no request on applications and getting below errors, which is  observed on Apache(mod_jk) & JBoss instance logs.

Caused by: java.net.SocketTimeoutException: SocketTimeoutException invoking http://192.168.104.92:8081/Homeport/DecisionSetupService: Read timed out


Apache logs:
File name : mod_jk.log
****************************************
[Mon Aug 06 08:18:04 2018][1756:5104] [info] ajp_handle_cping_cpong::jk_ajp_common.c (913): timeout in reply cpong
[Mon Aug 06 08:18:04 2018][1756:5104] [info] ajp_send_request::jk_ajp_common.c (1562): (standaloneProd) failed sending request, socket -1 prepost cping/cpong failure (errno=60)
 [Mon Aug 06 08:18:16 2018]standaloneProd 192.168.104.91 17.753141
[Mon Aug 06 08:18:16 2018]standaloneProd www.middlewarebox.com 22.620435
[Mon Aug 06 08:18:29 2018][1756:1604] [info] ajp_handle_cping_cpong::jk_ajp_common.c (913): timeout in reply cpong
***************************************

JBoss logs:
file name : 1-instance (server.log)
**************************************
08:23:33,449 ERROR [Booking] (ajp-/192.168.104.92:8009-6) [com.griffin.homeport.reservation.booking.interceptors.BookingHistoryInterceptor.intercept:136] Exception in Booking History Interceptor: javax.xml.ws.WebServiceException: Could not send Message.
                at org.apache.cxf.jaxws.JaxWsClientProxy.invoke(JaxWsClientProxy.java:145) [cxf-rt-frontend-jaxws-2.4.6.jar:2.4.6]
                at org.apache.tomcat.util.net.JIoEndpoint$Worker.run(JIoEndpoint.java:931) [jbossweb-7.0.17.Final.jar:]
                at java.lang.Thread.run(Thread.java:662) [rt.jar:1.6.0_35]
Caused by: java.net.SocketTimeoutException: SocketTimeoutException invoking http://192.168.104.92:8081/Homeport/DecisionSetupService: Read timed out
   Caused by: java.net.SocketTimeoutException: Read timed out
                at java.net.SocketInputStream.socketRead0(Native Method) [rt.jar:1.6.0_35]
                at java.net.SocketInputStream.read(SocketInputStream.java:129) [rt.jar:1.6.0_35]
               
08:24:00,812 ERROR [stderr] (pool-10-thread-610) java.io.IOException: An established connection was aborted by the software in your host machine 
****************************************


This issue is happening due, to long time idle AJP connections, for removing these idle connections
need to add below configuration

1 : On JBoss instance (standalone.xml).
**********************************
<system-properties>
                 <property name="org.apache.coyote.ajp.DEFAULT_CONNECTION_TIMEOUT" value="600000"/>
                <property name="org.apache.coyote.http11.DEFAULT_CONNECTION_TIMEOUT" value="120000"/>
<system-properties>

**********************************
Default connection timeout :
AJP connectionTimeout to 600000 (600000 millseconds = 600 seconds = 10 minutes)
HTTP connectionTimeout to 120000 (120000 millseconds = 120 seconds = 2 minutes)


2: On Apache Mod_jk (worker.properties)
**********************************
worker.list=standaloneProd,status
worker.standaloneProd.port=8009
worker.standaloneProd.host=192.168.104.92
worker.standaloneProd.type=ajp13
worker.standaloneProd.ping_mode=A
worker.standaloneProd.socket_connect_timeout=10000
worker.standaloneProd.connection_pool_size=150
worker.standaloneProd.connection_pool_timeout=600
worker.status.type=status

Saturday, 8 September 2018

HTTP STATUS CODES

This is a list of Hypertext Transfer Protocol (HTTP) response status codes.

Success (2XX)
This class of status codes indicates the action requested by the client was received, understood, accepted, and processed successfully.

·         200 OK :
The request has succeeded. The meaning of a success varies depending on the HTTP method:
GET: The resource has been fetched and is transmitted in the message body.
HEAD: The entity headers are in the message body.
PUT or POST: The resource describing the result of the action is transmitted in the message body.
TRACE: The message body contains the request message as received by the server
·         202 Accepted :
The request has been received but not yet acted upon. It is non-committal, meaning that there is no way in HTTP to later send an asynchronous response indicating the outcome of processing the request. It is intended for cases where another process or server handles the request, or for batch processing. 
·         203 Non-Authoritative Information :
This response code means returned meta-information set is not exact set as available from the origin server, but collected from a local or a third party copy. Except this condition, 200 OK response should be preferred instead of this response. 
·         204 No Content :
There is no content to send for this request, but the headers may be useful. The user-agent may update its cached headers for this resource with the new ones.


Redirection (3XX)
This class of status code indicates the client must take additional action to complete the request. Many of these status codes are used in URL redirection.

·         301 Moved Permanently :
This response code means that the URI of the requested resource has been changed. Probably, the new URI would be given in the response.

·         302 Found :
This response code means that the URI of requested resource has been changed temporarily. New changes in the URI might be made in the future. Therefore, this same URI should be used by the client in future requests.

·         304 Not Modified :
This is used for caching purposes. It tells the client that the response has not been modified, so the client can continue to use the same cached version of the response.

·         305 Use Proxy :
Was defined in a previous version of the HTTP specification to indicate that a requested response must be accessed by a proxy. It has been deprecated due to security concerns regarding in-band configuration of a proxy.
  
·         306 unused :
This response code is no longer used, it is just reserved currently. It was used in a previous version of the HTTP 1.1 specification.

·         307 Temporary Redirect :
The server sends this response to direct the client to get the requested resource at another URI with same method that was used in the prior request. This has the same semantics as the 302 Found HTTP response code, with the exception that the user agent must not change the HTTP method used: If a POST was used in the first request, a POST must be used in the second request.

·         308 Permanent Redirect :
This means that the resource is now permanently located at another URI, specified by the Location: HTTP Response header. This has the same semantics as the 301 Moved Permanently HTTP response code, with the exception that the user agent must not change the HTTP method used: If a POST was used in the first request, a POST must be used in the second request.


Client error (4XX)
The 4xx class of status codes is intended for situations in which the client seems to have erred.

·         400 Bad Request :
This response means that server could not understand the request due to invalid syntax.

·         401 Unauthorized :
Although the HTTP standard specifies "unauthorized", semantically this response means "unauthenticated". That is, the client must authenticate itself to get the requested response.

·         403 Forbidden :
The client does not have access rights to the content, i.e. they are unauthorized, so server is rejecting to give a proper response. Unlike 401, the client's identity is known to the server.

·         404 Not Found :
The server cannot find the requested resource. In the browser, this means the URL is not recognized. In an API, this can also mean that the endpoint is valid but the resource itself does not exist. Servers may also send this response instead of 403 to hide the existence of a resource from an unauthorized client. This response code is probably the most famous one due to its frequent occurrence on the web.

·         405 Method Not Allowed :
The request method is known by the server but has been disabled and cannot be used. For example, an API may forbid DELETE-ing a resource. The two mandatory methods, GET and HEAD, must never be disabled and should not return this error code.

 ·         408 Request Timeout :
This response is sent on an idle connection by some servers, even without any previous request by the client. It means that the server would like to shut down this unused connection. This response is used much more since some browsers, like Chrome, Firefox 27+, or IE9, use HTTP pre-connection mechanisms to speed up surfing. Also, note that some servers merely shut down the connection without sending this message.


Server error (5XX)
The server failed to fulfill an apparently valid request.
  
·         500 Internal Server Error :
The server has encountered a situation it doesn't know how to handle.

·         501 Not Implemented :
The request method is not supported by the server and cannot be handled. The only methods that servers are required to support (and therefore that must not return this code) are GET and HEAD.

·         502 Bad Gateway :
This error response means that the server, while working as a gateway to get a response needed to handle the request, got an invalid response.

·         503 Service Unavailable :
The server is not ready to handle the request. Common causes are a server that is down for maintenance or that is overloaded. Note that together with this response, a user-friendly page explaining the problem should be sent. This response should be used for temporary conditions and the Retry-After: HTTP header should, if possible, contain the estimated time before the recovery of the service. The webmaster must also take care about the caching-related headers that are sent along with this response, as these temporary condition responses should usually not be cached.

·         504 Gateway Timeout :
This error response is given when the server is acting as a gateway and cannot get a response in time.

·         505 HTTP Version Not Supported :
The HTTP version used in the request is not supported by the server.


Reference link: 


          Thanks :-)